Psy 520 topic 2 exercise Study guides, Class notes & Summaries
Looking for the best study guides, study notes and summaries about Psy 520 topic 2 exercise? On this page you'll find 60 study documents about Psy 520 topic 2 exercise.
All 60 results
Sort by
-
PSY 520 Topic 1,2,3,4,5,6&7 Latest Exercises with Complete Solutions: Grand Canyon University(Already Graded A)
- Package deal • 7 items • 2022
- $35.49
- + learn more
PSY 520 Topic 1 Exercise 1, Chapter 1 to 4 PSY 520 Topic 2 Exercise,Chapter 5 and 8 PSY 520 Topic 3 Exercise Chapter 7 and 8 PSY 520 Topic 4 Exercise, Chapter 9, 10, 11 and 12 PSY 520 Topic 5 Exercise:Chapter 13, 14 and 15 PSY 520 Topic 6 Exercise:Chapter 16, 17, 18 PSY 520 Topic 7 Exercise:Chapter 19 and 20
-
PSY 520 TOPIC 6 EXERCISE CHAPTER 16, 17 AND 18
- Exam (elaborations) • 17 pages • 2021
- $15.49
- + learn more
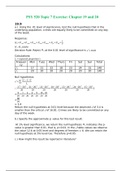
PSY 520 Topic 6 Exercise Chapter 16, 17 and 18 16.9 Given the aggression scores below for Outcome A of the sleep deprivation experiment, verify that, as suggested earlier, these mean differences …. seriously by testing the null hypothesis at the .05 level of significance. Use the computation formulas for the various sums of squares and summarize results with an ANOVA table. 16.10 Another psychologist conducts a sleep deprivation experiment. For reasons beyond his control, unequal number...
-
PSY 520 TOPIC 1 EXERCISE, CHAPTER 1 TO 4 ANSWERS
- Exam (elaborations) • 9 pages • 2021
- $13.49
- + learn more
PSY 520 Topic 1 Exercise (Two Different Solutions) CHAPTER ONE 1.8: Indicate whether each of the following studies is an experiment or an observational study. If it is an experiment, identify the independent variable and note any possible confounding variables. PSY 520 TOPIC 1 EXERCISE, CHAPTER TWO 2.14: (a) Construct a frequency distribution for the number of difference residences occupied by graduating seniors during their college career, namely 1, 4, 2, 3, 3, 1, 6, 7, 4, 3, 3, 9, 2, 4, 2, 2, ...
-
PSY 520 Topic 1,2,3,4,5,6&7 Graded A Exercises -Verified Latest Update 2023/2024
- Package deal • 7 items • 2020
- $13.49
- 1x sold
- + learn more
PSY 520 Topic 1,2,3,4,5,6&7 Graded A Exe/PSY 520 Topic 1 Exercise 1, Chapter 1 to 4 PSY 520 Topic 2 Exercise,Chapter 5 and 8 PSY 520 Topic 3 Exercise Chapter 7 and 8 PSY 520 Topic 4 Exercise, Chapter 9, 10, 11 and 12 PSY 520 Topic 5 Exercise:Chapter 13, 14 and 15 PSY 520 Topic 6 Exercise:Chapter 16, 17, 18 PSY 520 Topic 7 Exercise:Chapter 19 and 20
-
PSY 520 TOPIC 3 EXERCISE, CHAPTER 7 AND 8 ANSWERS
- Exam (elaborations) • 5 pages • 2021
- $15.49
- + learn more
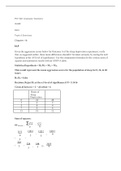
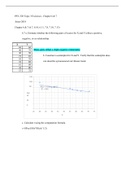
PSY 520 Topic 3 Exercise Chapter 7 and 8 6.7 (a) Estimate whether the following pairs of scores for X and Y reflect a positive relationship, a negative relationship, or no relationship. Hint: Note any tendency for pairs of X and Y scores to occupy similar or dissimilar relative locations. (b) Construct a scatterplot for X and Y . Verify that the scatterplot does not describe a pronounced curvilinear trend. (c) Calculate r using the computation formula (6.1). 6.10 On the basis of an ...

Fear of missing out? Then don’t!

-
Grand Canyon University:PSY 520 Topic 2 Exercise,Chapter 5 and 8;Verified Answers(Graded A)
- Exam (elaborations) • 9 pages • 2022
- $10.49
- + learn more
PSY-520 Topic 2 Exercises – Chapters 5 & 8 Jones-2018 5.11 Scores on the Wechsler Adult Intelligence Scale (WAIS) approximate a normal curve with a mean of 100 and a standard deviation on 15. What proportion of the IQ scores are a. above Kristen’s 125? z= 125-100/15= 1.67 using the z table on page 536 = 0.0475 b. below 82? z=82-100/15 = -1.2 C’=0.1151 c. Within 9 points of the mean? 100 +9=109 109-100/15=0.6 100-9=91 91-100/15=-0.6 B+B’ .2257+.2257 =0.4514 d. More than 40 p...
-
PSY 520 Topic 2 Exercise,Chapter 5 and 8-Latest Solution
- Exam (elaborations) • 7 pages • 2020
- $8.00
- + learn more
PSY 520 Topic 2 Exercise,Chapter 5 and 8-PSY 520 Topic 2 Exercise 5.11 Scores on the Wechsler Adult Intelligence Scale (WAIS) approximate a normal curve with a mean of 100 and a standard deviation of 15. What proportion of IQ scores are 5. 15 An investigator polls common cold sufferers, asking them to estimate the number of hours of physical discomfort caused by their most recent colds. Assume that their estimates approximate a normal curve with a mean of 83 hours and a standard deviation of 20 ...
-
Grand Canyon University:PSY 520 Topic 2 Exercise,Chapter 5 and 8;Verified Answers
- Other • 7 pages • 2020
- $10.98
- 8x sold
- + learn more
PSY 520 Topic 2 Exercise 5.11 Scores on the Wechsler Adult Intelligence Scale (WAIS) approximate a normal curve with a mean of 100 and a standard deviation of 15. What proportion of IQ scores are 5. 15 An investigator polls common cold sufferers, asking them to estimate the number of hours of physical discomfort caused by their most recent colds. Assume that their estimates approximate a normal curve with a mean of 83 hours and a standard deviation of 20 hours. 5.18 The body mass index ...

-
PSY 520 TOPIC 3 EXERCISE, CHAPTER 7 AND 8 ANSWERS
- Exam (elaborations) • 5 pages • 2021
- $14.49
- + learn more
PSY 520 Topic 3 Exercise Chapter 7 and 8 6.7 (a) Estimate whether the following pairs of scores for X and Y reflect a positive relationship, a negative relationship, or no relationship. Hint: Note any tendency for pairs of X and Y scores to occupy similar or dissimilar relative locations. (b) Construct a scatterplot for X and Y . Verify that the scatterplot does not describe a pronounced curvilinear trend. (c) Calculate r using the computation formula (6.1). 6.10 On the basis of an extensive su...
-
2022/2023 PSY 520 Topic 4 Exercise 2, Chapter 9, 10, 11 and 12;Verified Questions & Answers NEW UPDATE
- Exam (elaborations) • 4 pages • 2022
- $7.79
- + learn more
9.7 Define the sampling distribution of the mean. 9.8 Specify three important properties of the sampling distribution of the mean. 9.9 If we took a random sample of 35 subjects from some popula tion, the associated sampling distribution of the mean would have the following properties (true or false). 9.13 Given a sample size of 36, how large does the population standard deviation have to be in order for the standard error to be 9.14 (a) A random sample of size 144 is taken from the local popula...
