Psy 520 topic 2 exercise Study guides, Class notes & Summaries
Looking for the best study guides, study notes and summaries about Psy 520 topic 2 exercise? On this page you'll find 60 study documents about Psy 520 topic 2 exercise.
Page 3 out of 60 results
Sort by
-
Grand Canyon University:PSY 520 Topic 4 Exercise, Chapter 9, 10, 11 and 12 COMPLETE SOLUTION;Graded A (2022/2023)
- Other • 11 pages • 2020
- $10.98
- 11x sold
- + learn more
PSY 520 Topic 4 Exercise, Chapter 9, 10, 11 and 12 9.7 Define the sampling distribution of the mean. 9.8 Specify three important properties of the sampling distribution of the mean. 9.9 If we took a random sample of 35 subjects from some population, the associated sampling distribution of the mean would have the following properties (true or false). 9.13 Given a sample size of 36, how large does the population standard deviation have to be in order for the standard error to be 9....

-
Exam (elaborations) PSY 520 Topic 2 Exercises 520.docx
- Exam (elaborations) • 8 pages • 2021
- $14.49
- + learn more
roportions Scores on the Wechsler Adult Intelligence Scale (WAIS) approximate a normal curve with a mean of 100 and a standard deviation of 15. What proportion of IQ scores are WAIS mean = 100; standards deviation = 15 a. Above Kristen’s 125? µ = 100 ; = 15 ơ z= X−μ σ = 125−100 15 = 25/15 => z = 1.67 looking at table A a , it gives us a value of C = 0.0475. b. Below 82 z = 82−100 15 = −18 15 = -1.2, so z value of -1.2 gives us a C value of 0.1151 c. Within 9...
-
Grand Canyon University:PSY 520 Topic 1 Exercise 1, Chapter 1 to 4;Verified Answers(Graded A)-Latest 2022/2023
- Other • 6 pages • 2020
- $9.98
- 5x sold
- + learn more
PSY 520 Topic 1 Exercise Chapter One 1.8 Indicate whether each of the following studies is an experiment or an observational study. If it is an experiment, identify the independent variable and note any possible confounding variables. Chapter Two 2.14 (a) Construct a frequency distribution for the number of difference residences occupied by graduating seniors during their college career, namely 1, 4, 2, 3, 3, 1, 6, 7, 4, 3, 3, 9, 2, 4, 2, 2, 3, 2, 3, 4, 4, 2, 3, 3, 5 (b) What i...
-
PSY 520 Topic 2 Exercises
- Exam (elaborations) • 11 pages • 2021
- $12.49
- + learn more
PSY 520 Topic 2 Exercises

-
PSY 520 Topic 3 Exercise Chapter 7 and 8, (Latest New Version-2):-Grand Canyon University
- Study guide • 7 pages • 2020
- $15.49
- + learn more
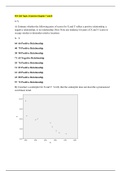
PSY 520 Topic 3 Exercise Chapter 7 and 8, (Latest New Version-2):-Grand Canyon University Grand Canyon University:PSY 520 Topic 3 Exercise Chapter 7 and 8 COMPLETE SOLUTION;Graded A PSY 520 Topic 3 Exercise Chapter 7 and 8 6.7 (a) Estimate whether the following pairs of scores for X and Y reflect a positive relationship, a negative relationship, or no relationship. Hint: Note any tendency for pairs of X and Y scores to occupy similar or dissimilar relative locations. (b) Construct a scatterplo...


-
PSY 520 Topic 2 Exercises
- Exam (elaborations) • 11 pages • 2021
- $14.98
- + learn more
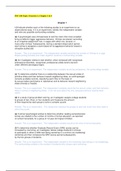
PSY 520 Topic 2 Exercises Chapter 5 5.11 Scores on the Wechsler Adult Intelligence Scale (WAIS) approximate a normal curve with a mean of 100 and a standard deviation on 15. What proportion of the IQ scores are a. above Kristen’s 125? z= 125-100/15= 1.67 using the z table on page 536 = 0.0475 b. below 82? z=82-100/15 = -1.2 C’=0.1151 c. Within 9 points of the mean? 100 +9=109 109-100/15=0.6 100-9=91 91-100/15=-0.6 B+B’ .2257+.2257 =0.4514 d. More than 40 point...
-
PSY 520 Topic 2 Exercises/GCU PSY 520
- Exam (elaborations) • 11 pages • 2021
- $15.49
- + learn more
Chapter 5 5.11 Scores on the Wechsler Adult Intelligence Scale (WAIS) approximate a normal curve with a mean of 100 and a standard deviation on 15. What proportion of the IQ scores are a. above Kristen’s 125? z= 125-100/15= 1.67 using the z table on page 536 = 0.0475 b. below 82? z=82-100/15 = -1.2 C’=0.1151 c. Within 9 points of the mean? 100 +9=109 109-100/15=0.6 100-9=91 91-100/15=-0.6 B+B’ .2257+.2257 =0.4514 d. More than 40 points from the mean? 100+40=140...
-
PSY 520 TOPIC 1 EXERCISE, CHAPTER 1 TO 4 ANSWERS
- Exam (elaborations) • 9 pages • 2021
- $15.49
- + learn more
PSY 520 Topic 1 Exercise (Two Different Solutions) CHAPTER ONE 1.8: Indicate whether each of the following studies is an experiment or an observational study. If it is an experiment, identify the independent variable and note any possible confounding variables. PSY 520 TOPIC 1 EXERCISE, CHAPTER TWO 2.14: (a) Construct a frequency distribution for the number of difference residences occupied by graduating seniors during their college career, namely 1, 4, 2, 3, 3, 1, 6, 7, 4, 3, 3, 9, 2, 4...

-
PSY 520 Topic 6 ExerciseChapter 16, 17, 18, (Latest New Version-1): -Grand Canyon University
- Study guide • 14 pages • 2020
- $15.49
- + learn more
PSY 520 Topic 6 Exercise Chapter 16, 17, 18, (Latest New Version-1): -Grand Canyon University Grand Canyon University_PSY 520 Topic 6 Exercise:Chapter 16, 17, 18 COMPLETE SOLUTION PSY 520 Topic 6 Exercises 16.9 Given the aggression scores below for Outcome A of the sleep deprivation experiment, verify that, as suggested earlier, these mean differences shouldn’t be taken seriously by testing the null hypothesis at the .05 level of significance. Use the computation formulas for the various sum...
-
Grand Canyon University:PSY 520 Topic 3 Exercise Chapter 7 and 8 COMPLETE SOLUTION;Graded A
- Other • 6 pages • 2020
- $10.98
- 2x sold
- + learn more
PSY 520 Topic 3 Exercise Chapter 7 and 8 6.7 (a) Estimate whether the following pairs of scores for X and Y reflect a positive relationship, a negative relationship, or no relationship. Hint: Note any tendency for pairs of X and Y scores to occupy similar or dissimilar relative locations. (b) Construct a scatterplot for X and Y . Verify that the scatterplot does not describe a pronounced curvilinear trend. (c) Calculate r using the computation formula (6.1). 6.10 On the basis of an extensi...
